Profiling Jev judge calls in a world-model planner: where the savings come from, and why Reducer recommends native
We ran Reducer's diagnostic workflow on a public planning workload in which Jev, TypeSafe's decision model, judges imagined robot trajectories against plain-English constraints. We measured it both against recorded answers and live against the Jev API.
Summary. We ran Reducer's diagnostic workflow on a public planning workload in which Jev, TypeSafe's decision model, judges imagined robot trajectories against plain-English constraints. We measured it both against recorded answers and live against the Jev API.
- Exact reuse is where the savings are. Live, reusing answers to exactly repeated questions cut Jev input tokens by 75.6% (questions sent by 76.2%) across 24 held-out episodes. Success and violation rates were unchanged. The public planner LeJudge already ships this cache, so the saving is LeJudge's, not Reducer's.
- Live Jev answers depend on their context. The identical request repeated varied by 0.038 per question. Asking the same question in different batches varied it by 0.129 on average. An exact cache therefore freezes one draw from one context: cheaper, but not neutral.
- Reducer grouping: Reducer has no algorithm that groups different judge questions, so that arm is unsupported. The Reducer wrapper alone added no reduction.
- Recommendation: for this workload Reducer recommends retain native.
A separate, clearly labeled section shows the training-telemetry integration we exercised on Reducer's existing training pipeline. It is not about Jev, and Jev was not trained.
Measurement modes: live (POST /v1/systemone, model jev-1.13.0, 2026-09-28, total $0.127 at list price, 412 request attempts under a hard $1 cap), recorded replay (genuine jev-1.13.0 answers published by LeJudge's author, recorded 2026-09-22), a local simulator and local training. Dollar figures are list-price estimates from returned token usage, not invoices.
The workload
LeJudge plans pushes in the PushT task with a JEPA world model (LeWM).
- For each replan, a CEM planner imagines 300 candidate action sequences × 5 steps.
- Linear probes turn each imagined step into words: grid cell, wall contact, angle, contact and speed.
- Jev answers one yes/no (Noul) question per constraint and step, for example: "does the block violate 'Keep the T out of the centre cell.' at step t?".
- The probabilities become a penalty added to the planner's goal cost.
We replayed LeJudge's published study-1 starting conditions: 48 of 90 roots, split before any run into 12 discovery, 12 calibration and 24 held-out roots. The runs used its unmodified planner, world model, probes and scoring. The resulting planning.jsonl has 427 planner events from 48 roots, with 128,100 candidate trajectories. Each row is one judged CEM iteration with its full candidate population.
As a sanity check, our closed-loop outcomes on the same roots matched the published ones:
- success: 41/48 roots;
- violation: 47/48 roots.
They are not identical, because our starts are rebuilt from 5-decimal published states on different Apple hardware.
The answers are genuine recorded Jev outputs. We recovered 31,453 of LeJudge's 33,947 cached step answers by re-deriving its cache keys over the closed vocabulary. Questions without a recorded answer were treated as follows:
- Fixed trace: the whole row is excluded from every arm.
- Closed loop: the step is left unjudged, which is LeJudge's own behavior. The unjudged rate was 3.52% of lookups.
Nothing was guessed.
A real request and a measured reuse example are in the package's examples file.
What Reducer did — and did not do
We compared four arms, all with identical within-event de-duplication and batching of at most 512 questions per request:
Arm
- NATIVE — What it does: Per-event batching, no reuse across planner iterations
- EXACT_CACHE — What it does: Reuses an answer only when the question is exactly identical (model, question bank, constraint text, step index and every word). This is what LeJudge already does.
- REDUCER_NOOP — What it does: Reducer's wrapper with an identity policy; it must reproduce EXACT_CACHE
- REDUCER — What it does: BLOCKED. No recovered Reducer algorithm maps a judge question to a representative class. Reducer's training selector samples examples, and its KV reducer works inside one context. We did not substitute nearest-neighbour caching or new clustering under the Reducer name.
Results
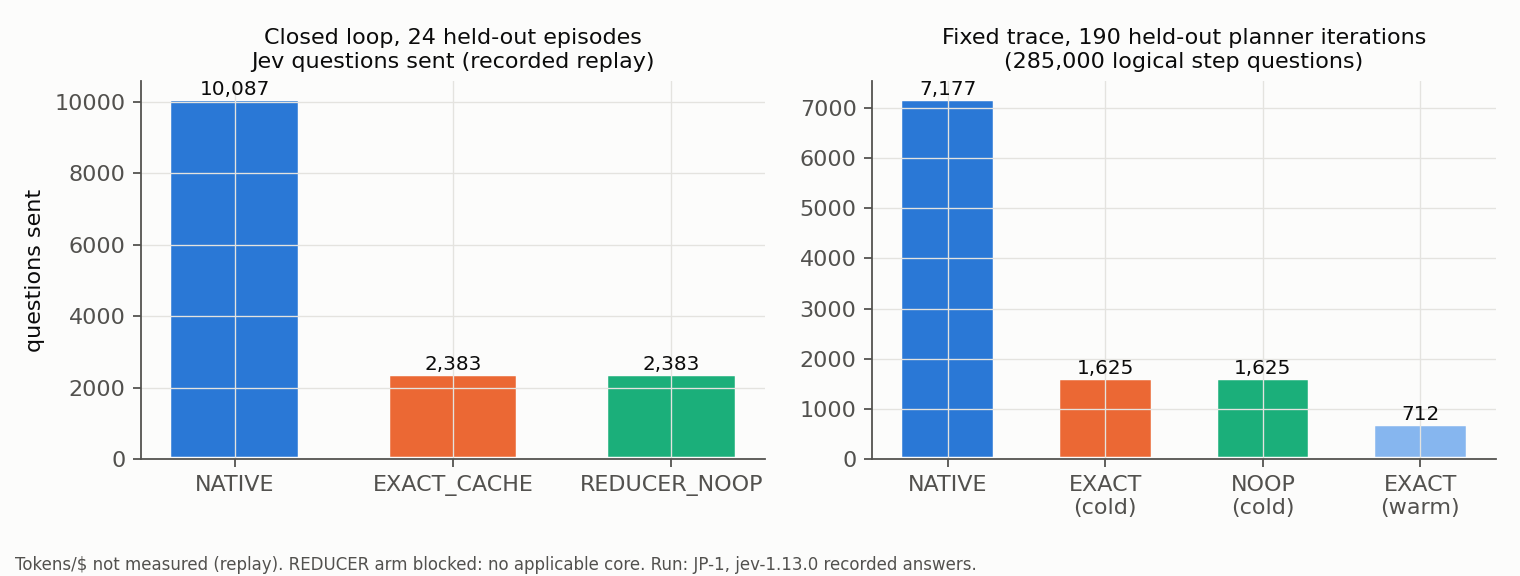
Judge work (Figure 1)
Held-out, closed loop (24 episodes)
- Unique questions per event, summed — NATIVE: 10,087 — EXACT_CACHE: 10,087 — REDUCER_NOOP: 10,087
- Questions sent to Jev — NATIVE: 10,087 — EXACT_CACHE: 2,383 — REDUCER_NOOP: 2,383
- Provider requests — NATIVE: 217 — EXACT_CACHE: 89 — REDUCER_NOOP: 89
- Change vs EXACT_CACHE, questions sent — NATIVE: -323.3% — EXACT_CACHE: 0% — REDUCER_NOOP: 0.0%
Under recorded replay, EXACT_CACHE sent 76.4% fewer questions than NATIVE.
Fixed trace, using the identical frozen candidates of 190 replayable held-out rows (27 rows excluded for a replay miss):
Arm
- NATIVE — Logical step questions: 285,000 — Questions sent: 7,177 — Requests: 190 — Same chosen candidate as NATIVE: —
- EXACT_CACHE (cold) — Logical step questions: 285,000 — Questions sent: 1,625 — Requests: 72 — Same chosen candidate as NATIVE: 190/190
- REDUCER_NOOP (cold) — Logical step questions: 285,000 — Questions sent: 1,625 — Requests: 72 — Same chosen candidate as NATIVE: 190/190
- EXACT_CACHE (warm from discovery+calibration only) — Logical step questions: 285,000 — Questions sent: 712 — Requests: 65 — Same chosen candidate as NATIVE: 190/190
In the cold runs, EXACT_CACHE sends exactly the 1,625 distinct held-out questions. Most of the logical work is removed by within-event de-duplication, which every arm does and which LeJudge also does natively.
Figure: Judge questions by arm
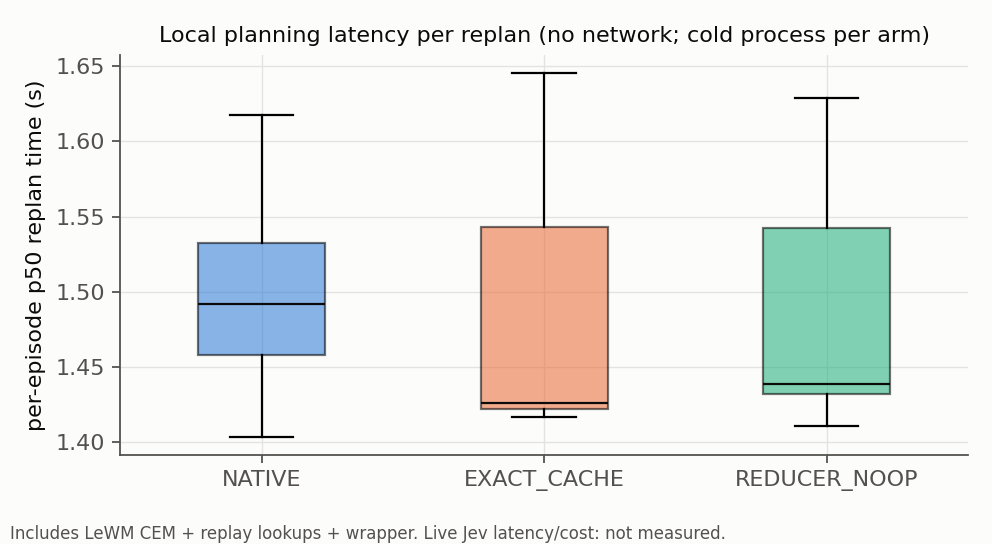
Planning latency under replay (Figure 2)
The median per-episode replan time was:
- NATIVE: 1.49 s;
- EXACT_CACHE: 1.43 s;
- REDUCER_NOOP: 1.44 s.
These are local compute times with instant replay lookups, so they contain no network time. The live section below reports network latency, tokens and cost.
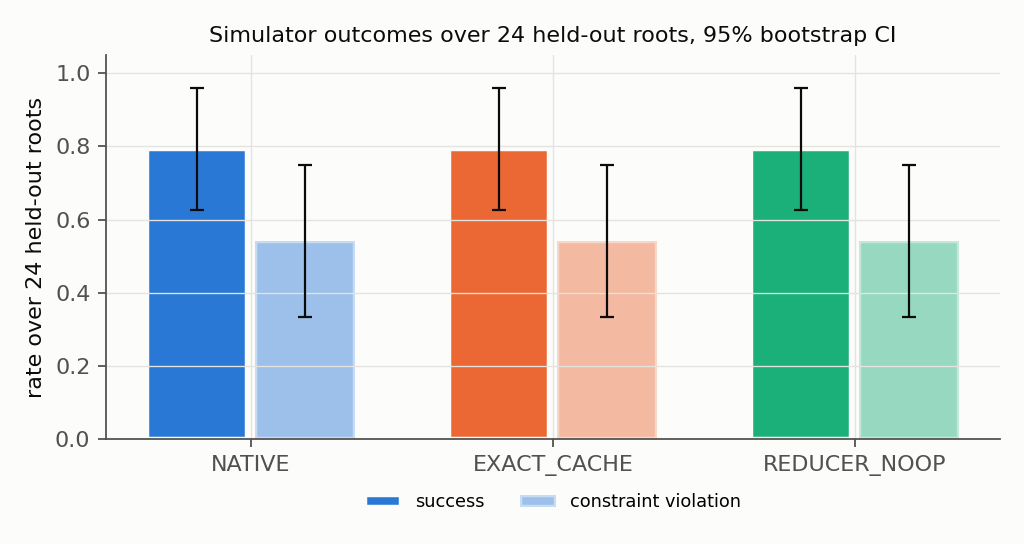
Decisions and planning outcomes (Figure 3)
24 held-out episodes
- NATIVE — Success [95% CI]: 0.79 [0.62, 0.96] — Executed constraint violation [95% CI]: 0.54 [0.33, 0.75] — Identical to EXACT_CACHE, per root: 24/24
- EXACT_CACHE — Success [95% CI]: 0.79 [0.62, 0.96] — Executed constraint violation [95% CI]: 0.54 [0.33, 0.75] — Identical to EXACT_CACHE, per root: —
- REDUCER_NOOP — Success [95% CI]: 0.79 [0.62, 0.96] — Executed constraint violation [95% CI]: 0.54 [0.33, 0.75] — Identical to EXACT_CACHE, per root: 24/24
Because a recorded answer is a single value per question, exact reuse cannot change a decision under replay. The identical outcomes confirm the plumbing; they are not a new quality finding.
Live answers are not single values. The live section below measures how much they vary and what that does to closed-loop trajectories.
The high violation rate is the workload itself, which LeJudge's paper attributes mainly to world-model drift. Reducer did not cause it.
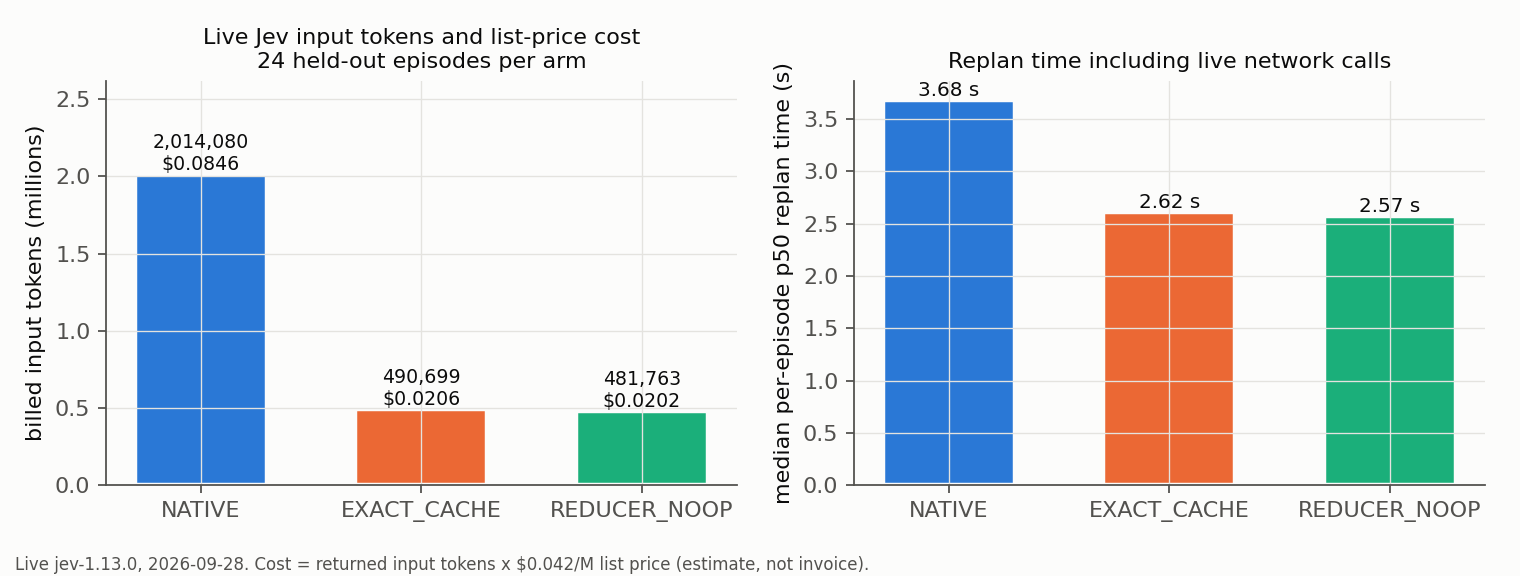
Live Jev results (Figure 5)
A known-answer preflight passed (PASS) before the panel ran. We then ran the same 24 held-out episodes once per arm against the live API. Each arm started with an empty cache, and the batching was identical across arms.
Live, 24 held-out episodes
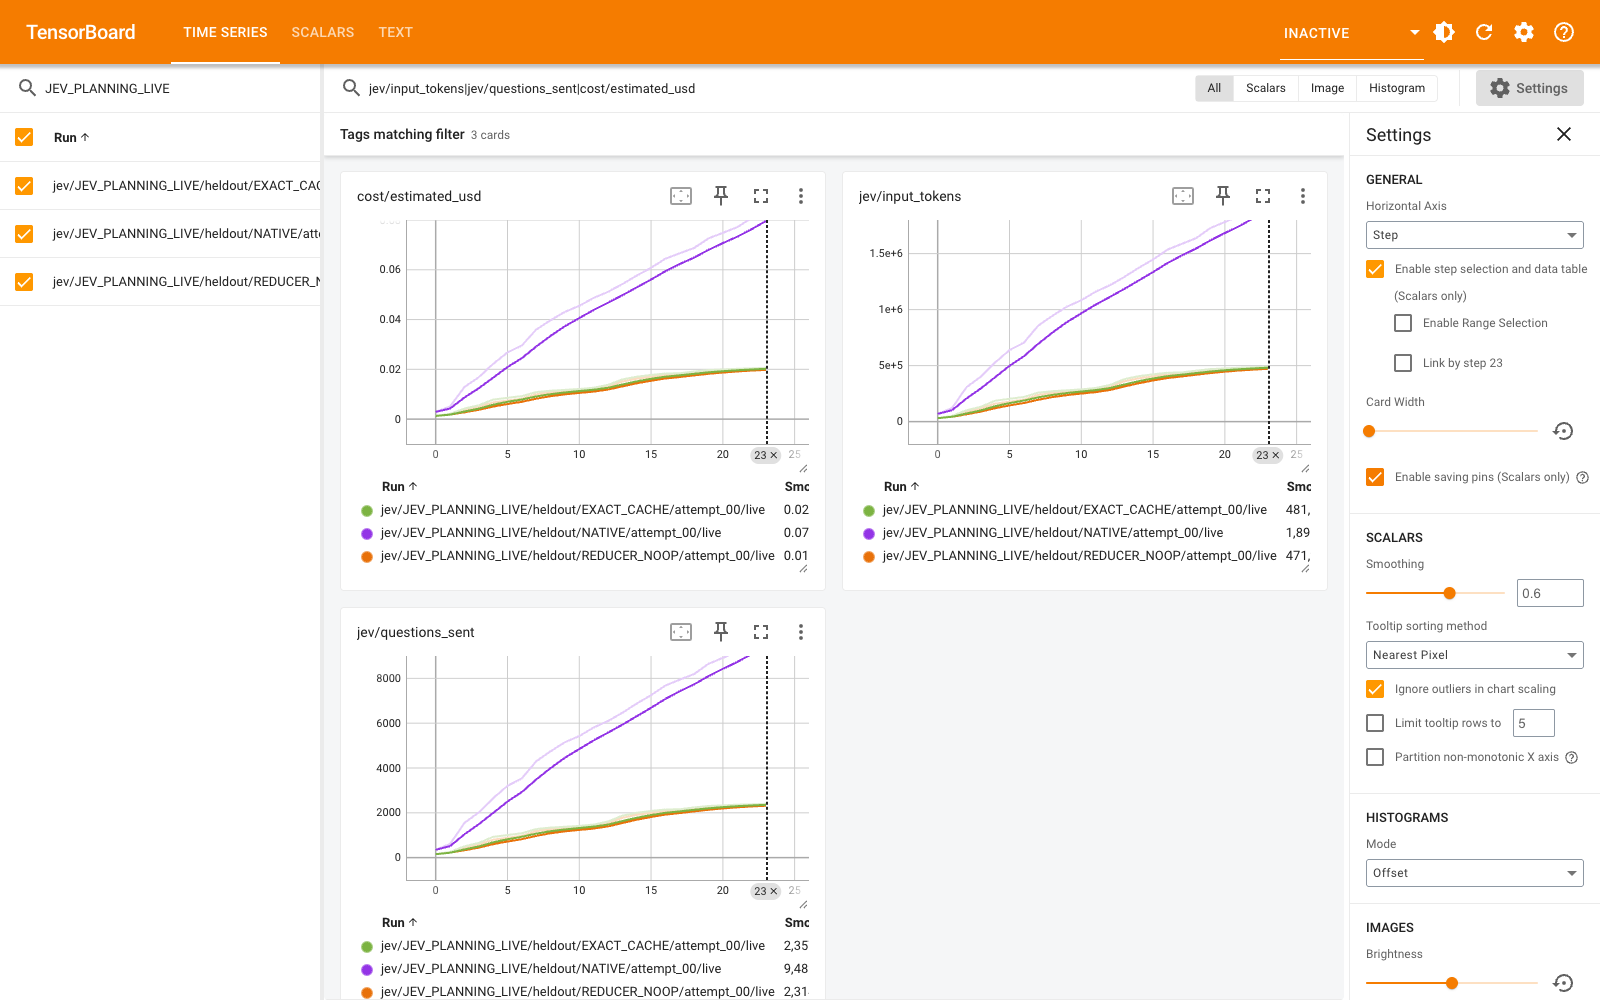
- Questions sent — NATIVE: 10,077 — EXACT_CACHE: 2,401 — REDUCER_NOOP: 2,362
- HTTP requests (attempts / failed) — NATIVE: 217 (217 / 0) — EXACT_CACHE: 94 (94 / 0) — REDUCER_NOOP: 89 (89 / 0)
- Billed input tokens — NATIVE: 2,014,080 — EXACT_CACHE: 490,699 — REDUCER_NOOP: 481,763
- List-price cost — NATIVE: $0.0846 — EXACT_CACHE: $0.0206 — REDUCER_NOOP: $0.0202
- Request latency p50 / p95 (s) — NATIVE: 0.22 / 0.46 — EXACT_CACHE: 0.21 / 0.41 — REDUCER_NOOP: 0.19 / 0.38
- Median replan time incl. network (s) — NATIVE: 3.68 — EXACT_CACHE: 2.62 — REDUCER_NOOP: 2.57
- Success [95% CI] — NATIVE: 0.79 [0.62, 0.96] — EXACT_CACHE: 0.79 [0.62, 0.92] — REDUCER_NOOP: 0.79 [0.62, 0.96]
- Violation [95% CI] — NATIVE: 0.54 [0.33, 0.75] — EXACT_CACHE: 0.54 [0.33, 0.75] — REDUCER_NOOP: 0.54 [0.33, 0.75]
- Same trajectory as EXACT_CACHE, per root — NATIVE: 15/24 — EXACT_CACHE: — — REDUCER_NOOP: 15/24
- Savings: exact reuse removed 75.6% of billed input tokens.
- Wrapper: relative to EXACT_CACHE, the Reducer wrapper differed by 1.8% in tokens. That is run-to-run variation, not a reduction.
- Trajectories: live answers vary between calls, so the arms' trajectories diverged on some roots. The aggregate outcome rates did not change.
Live answers depend on their context. For 14,623 live questions that also had a recorded 2026-09-22 answer, the mean |p_live − p_recorded| was 0.109 (p95 0.31). Live and recorded answers agreed on direction (Pearson r 0.735), but live answers ran higher: mean p 0.344 live against 0.254 recorded.
A small follow-up diagnostic (11 requests) separated the sources:
- Repeat noise: sending an identical 40-question batch three times moved each answer by 0.038 on average.
- Batch context: asking a question alone instead of inside that batch moved it by 0.042.
So Jev's answer to a step question is not a fixed function of that question. An exact cache saves the calls, but it pins whichever draw and context came first. In this panel that changed no aggregate outcome.
Figure: Live Jev tokens and cost by arm
Recommendation
- Reducer grouping: UNSUPPORTED.
- Exact reuse: RETAIN_NATIVE. The benefit is already in the native planner.
- Reducer wrapper: RETAIN_NATIVE.
- Exported configuration bundle: PASS. The bundle reloaded in a fresh process, rejected a mismatched model revision, and sends unknown contexts to the native path.
Break-even cannot be computed: Reducer adds no recurring saving over the exact cache that native already has.
Separate demonstration: training telemetry on Reducer's training pipeline (not Jev)
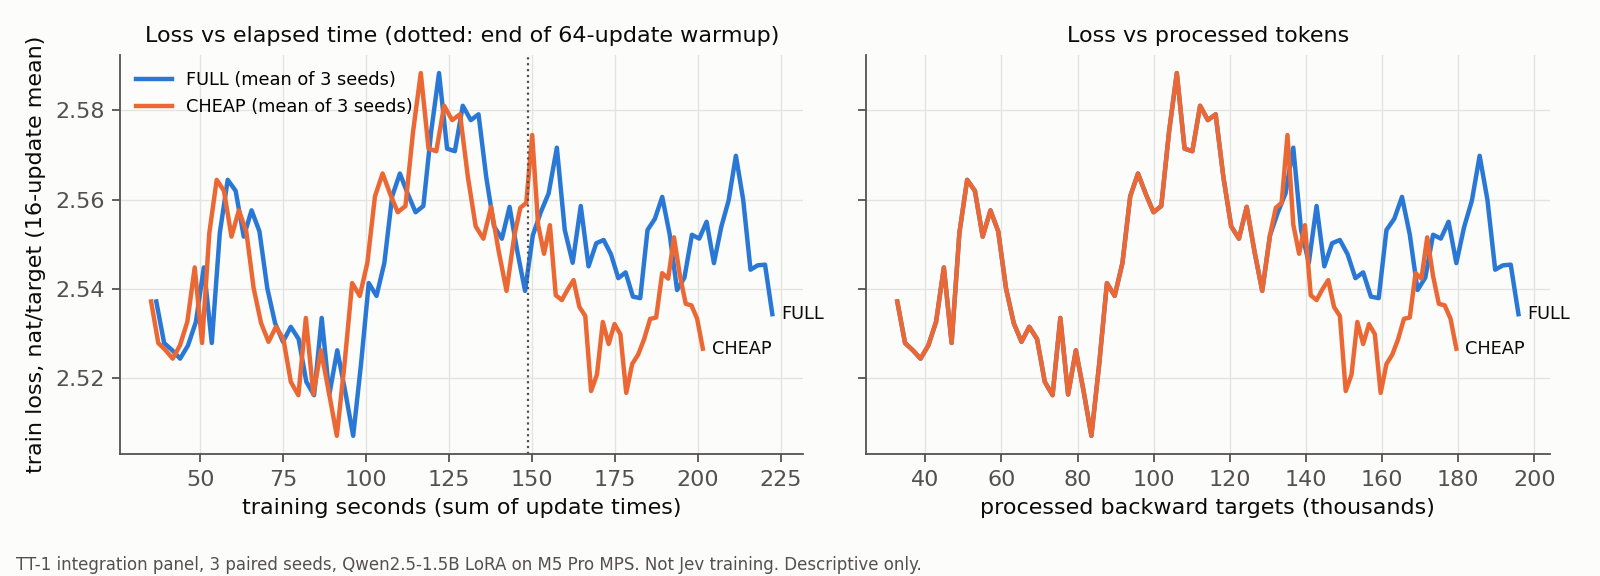
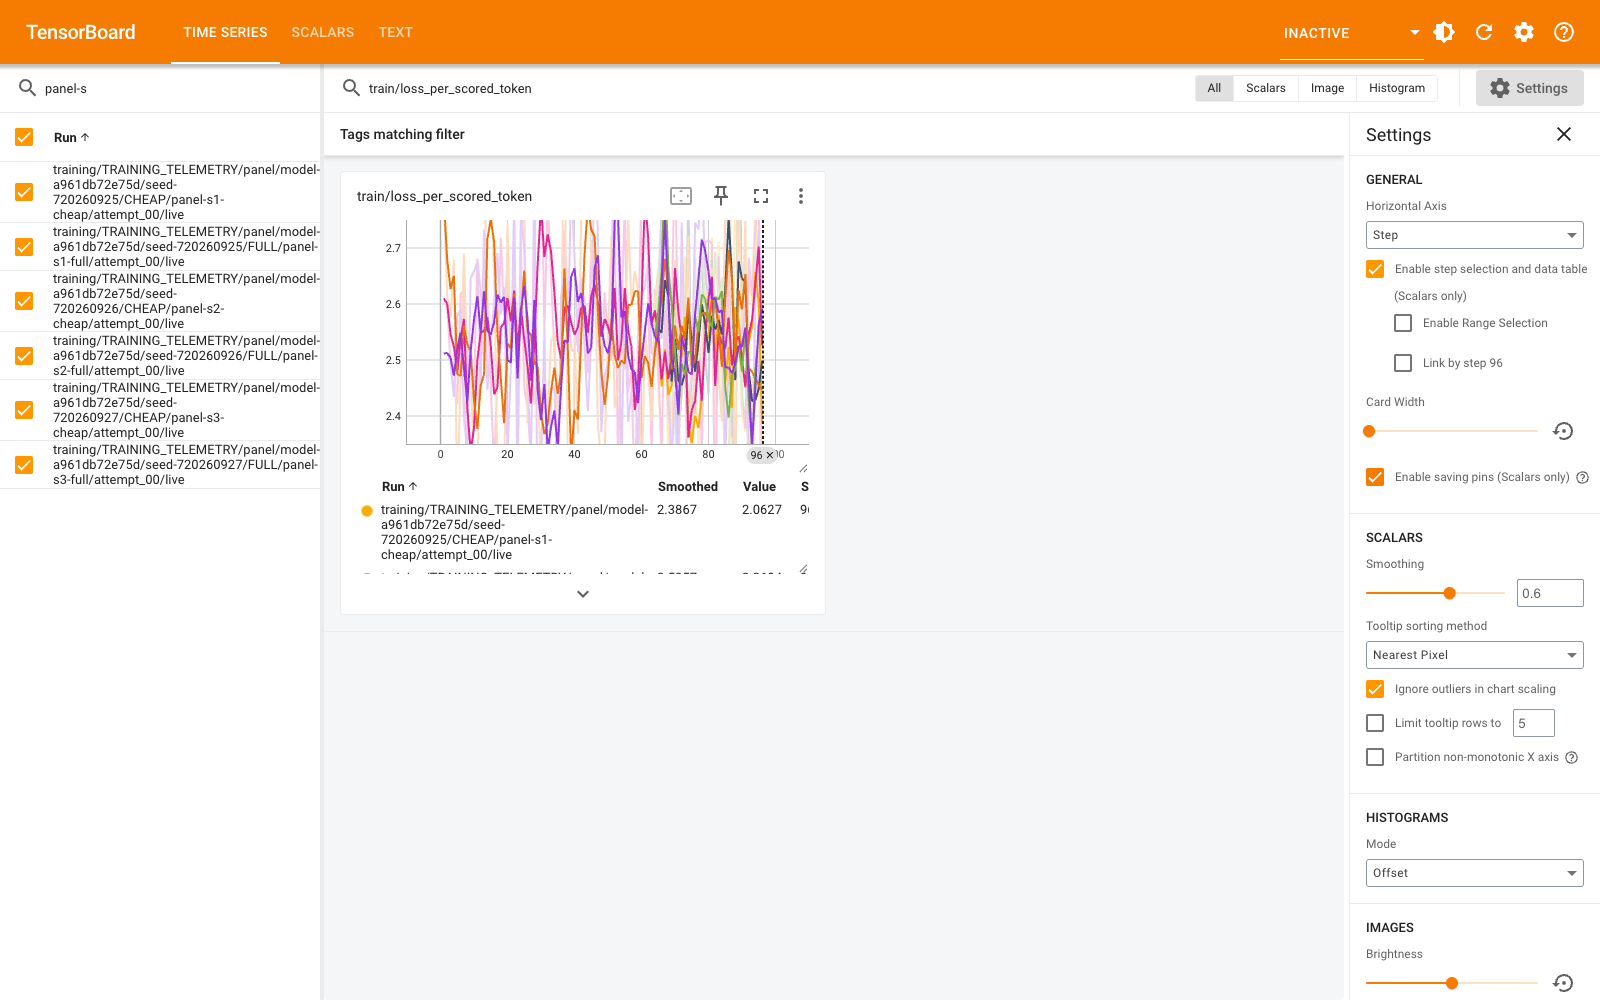
We also connected TensorBoard communication to Reducer's existing training path. This panel used the smallest real supported checkpoint (Qwen2.5-1.5B with LoRA) on a local Apple M5 Pro, with 3 paired seeds of FULL versus the existing CHEAP75 example-retention selector. After a 64-update warmup, CHEAP75 keeps 6 of every 8 examples. Each run was 96 updates, including 32 in the active reduction phase.
Instrument checks (all must pass before any timing is read):
- 100%-retention NOOP: PASS. Maximum adapter difference was 0.0.
- Selector reference parity: PASS.
- Interrupt/resume: PASS.
- Physical omission (dropped examples never reach forward or backward): PASS. CHEAP ran 704 backward examples against FULL's 768.
- Learning mechanics and fresh-process export reload: PASS.
Telemetry checks:
- 15,967 hash-chained events with every lifecycle state (PASS).
- TensorBoard event files read back equal to the ledger for 14/14 (PASS).
- A registered sink-failure drill backfilled from the ledger (PASS).
- Metrics were checked through a loopback TensorBoard server's HTTP API (PASS).
Descriptive timing and quality:
- CHEAP used a geometric-mean 0.906× the training time of FULL, i.e. 9.4% less. Per pair the ratio ranged 0.836–0.949.
- For comparison, the backward-work ratio is 0.917.
- Mean DEV NLL difference (CHEAP − FULL) was +0.00040 nat.
- Both arms learned: the DEV NLL gain over the base model was 0.0368–0.0384 nat.
With three short pairs this is an integration demonstration, not evidence of general training savings. It matches earlier CHEAP75 studies, which found savings below their 10% materiality gate.
Figure: Training loss vs time and tokens
Limitations
- One live panel. It was a single run of 24 episodes per arm on one day. The costs are list-price estimates, not invoices. Replay results (recorded 2026-09-22) and live results are reported separately and never pooled.
- No Reducer grouping. Nothing here tests whether a grouping algorithm could beat exact caching on this workload. Verified semantic caching, such as vCache, is prior art for that question.
- Scale. The panel is one constraint set and 24 held-out episodes. With identical outcomes, the conclusion is "no difference observed", not "no risk".
- Assumption behind the exact cache. It assumes Jev's answer to a step question does not depend on the other questions batched with it. Our live diagnostic shows that it does. TypeSafe's cookbook shows one question whose mean moved by 0.010 between batched and single calls.
- Replay coverage. The closed loop left 3.52% of lookups unjudged.
TensorBoard (real screenshots)
These are screenshots of the task's own TensorBoard server, bound to localhost only. They show the live Jev arms and the paired training loss:
Figure: TensorBoard: live Jev questions and tokens Figure: TensorBoard: training loss, paired panel
Reproduce
Commands, versions and hashes are in the package README and cli_transcript.txt.
- Hardware: Apple M5 Pro.
- Software: LeJudge b2e578f, LeWM 22b330c, torch 2.14 (planner) and 2.13 (training), Qwen2.5-1.5B cf34121.
Attribution
- LeJudge by Abdel (MIT): planner, question bank, and the recorded Jev answers.
- LeWM (quentinll/lewm-pusht, MIT).
- Jev and the System One API by TypeSafe. This is an independent measurement; no partnership or endorsement is implied.
If you run Jev or another decision API inside a planner, Reducer's profiling pilot measures where your judge calls go and whether anything beyond your existing cache is worth adopting, including when the answer is to keep what you have.